Introduction to Deciles
When diving into the world of data analysis, you often encounter terms that might seem intimidating at first. One such term is “deciles.” While it may sound complex, understanding deciles can significantly enhance your ability to interpret and analyze data effectively. Imagine being able to divide a dataset into ten meaningful segments, gaining insights that help you make informed decisions. Whether you’re in finance, marketing, or any field reliant on data-driven choices, mastering deciles can elevate your analytical skills.
In this guide, we’ll unravel the mystery behind deciles. We’ll break down how they are calculated and explore their importance in various contexts. Furthermore, we will discuss both the advantages and limitations of using decile analysis while illustrating real-life examples where these metrics shine. Ready to transform your approach to data? Let’s dive right in!
How Deciles are Calculated
To calculate deciles, you first need to arrange your data in ascending order. This step lays the foundation for effective analysis.
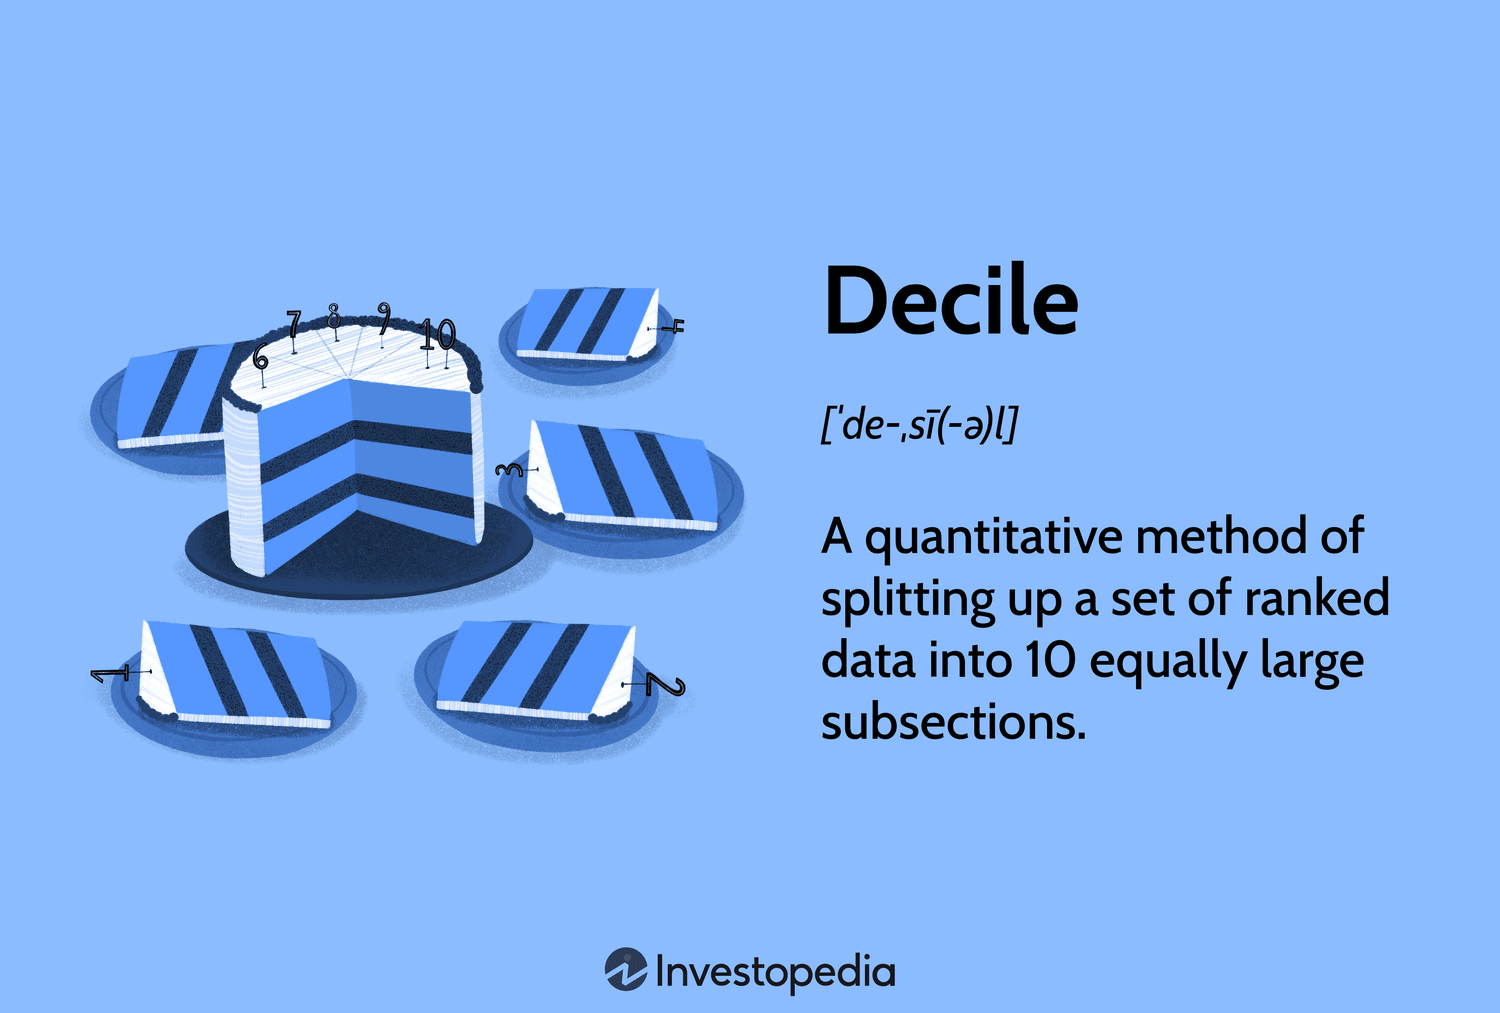
Next, divide your dataset into ten equal parts. Each part represents a decile. The first decile (D1) includes the lowest 10% of values, while the tenth decile (D10) contains the highest 10%.
The formula for finding each decile involves determining specific positions within your ordered list. For example, to find D1, you’d multiply the total number of observations by 0.1 and round up to get its position.
Data can be continuous or discrete; either way, ensure accuracy in placement. If a value falls between two data points when calculating a particular decile, interpolation may be necessary for precise results.
This method reveals how values are distributed across different ranges and highlights trends effectively throughout the dataset.
Importance of Deciles in Data Analysis
Deciles play a crucial role in data analysis by providing insights into distribution and variability. By dividing a dataset into ten equal parts, deciles help to identify the relative position of values within that set. This makes them especially useful for understanding large amounts of data.
When analyzing income levels, for instance, deciles can reveal how wealth is distributed across different segments of the population. Analysts can easily determine what percentage falls below or above certain thresholds.
Moreover, utilizing deciles allows businesses to segment their customer base effectively. By recognizing trends among different groups, companies can tailor marketing strategies and improve service delivery.
In research contexts, decile analysis assists in the identification of outliers and anomalies. It provides clarity on extreme values that might skew results if not addressed properly. This level of detail elevates decision-making processes significantly.
Advantages and Limitations of Using Deciles
Deciles offer valuable insights in data analysis. They break down datasets into ten equal parts, making it easier to understand the distribution of values. This granularity helps identify trends and patterns that might be missed when looking at averages alone.
However, relying solely on deciles has its drawbacks. For one, they can oversimplify complex data sets. Key information may be lost when focusing only on these divisions.
Another limitation is the sensitivity to outliers. Extreme values can skew results, affecting how segments are perceived. It’s crucial to consider this factor when interpreting decile outcomes.
Despite these challenges, incorporating deciles into your analytical toolkit remains beneficial for many scenarios. Balancing their use with other statistical methods can enhance overall insight while mitigating potential downsides.
Real-life Examples of Decile Analysis
Decile analysis finds its application in various fields, from finance to education. In retail, companies often analyze customer spending habits using deciles. By categorizing customers into ten groups based on their purchase amounts, they can tailor marketing strategies effectively.
In education, schools utilize deciles to assess student performance. By dividing students’ test scores into decile ranges, educators identify the top and bottom performers. This drives targeted interventions for those who need extra support.
Healthcare providers also leverage decile analysis to evaluate patient outcomes. Hospitals may categorize patients by risk levels using health-related metrics divided into ten segments. This helps prioritize care resources efficiently.
Even in sports analytics, teams examine player statistics through deciles. Coaches can see which players fall within specific performance bands, helping them make informed decisions during recruitment or training sessions.
How to Interpret Decile Results
Interpreting decile results is crucial for extracting meaningful insights from your data. Each decile divides your dataset into ten equal parts, allowing you to assess how values are distributed within it.
When looking at the first decile (D1), you can see that 10% of the observations fall below this point. This helps highlight lower performance metrics or income levels, depending on the context.
Conversely, examining D9 reveals where 90% of observations lie below this threshold. It’s often useful for identifying high performers or top-tier segments in business analytics.
Understanding these boundaries helps pinpoint trends and anomalies in your data. By analyzing differences between various deciles, you can uncover patterns that might otherwise go unnoticed.
Remember to consider the context; different datasets may yield varying interpretations based on industry standards and specific objectives. Always keep an eye out for what drives changes between each segment.
Conclusion
Deciles serve as a valuable tool in data analysis, offering insights that can drive decision-making and strategy. By breaking down datasets into ten equal parts, they help identify trends and patterns that may not be immediately evident. Understanding how to calculate deciles enables analysts to interpret data more effectively.
The importance of decile analysis cannot be overstated. It allows businesses and researchers to assess performance metrics, evaluate risk levels, or even segment customers based on various criteria. Despite their advantages, it’s crucial to recognize the limitations associated with using deciles—especially when dealing with skewed distributions.
Real-life applications demonstrate just how versatile decile analysis can be. For instance, marketers often use it to identify customer segments for targeted campaigns while financial analysts might apply it to assess portfolio risks.
Interpreting results is key; understanding what each decile represents within the context of your specific dataset can lead you toward actionable insights.
Armed with this knowledge about deciles, you’re now prepared to delve deeper into your analyses or apply these principles in practical scenarios. Embracing this statistical method could enhance both your understanding and application of data analytics significantly.
Leave a Reply